Question 3 (a)
Returns to scale: types, diagrams and causes
9 marks
- Time to write
- About 18 minutes
Question
Question 3 (a) · 9 marksUsing suitable diagrams, describe the different types of returns to scale. Discuss the factors that cause each of them to occur.
Reworded from the university paper; the task is the same. The original paper belongs to the University of Delhi. See DU's question bank.
Before you write
Read off the question and its marks
Read from the question
- DiscussEach point named and explained, not just listed.
Write it in this order
- Read; underline the asks; jot your points 1 min
- 1 Meaning of returns to scale 1 mark 1 min
- 2 Three types with isoquant diagrams 4 marks 8 min
- 3 Factors responsible for each 3 marks 6 min
- 4 Conclusion 1 mark 1 min
- Check: every ask answered, key terms underlined 1 min
Easy marks
- Meaning of returns to scale (step 1, 1 mark): a definition in one or two lines. It opens the answer, so it takes a minute or two.
Short on time? Keep step 1 short. Trim steps 2 and 3 evenly rather than skip one: each is capped at its own marks. End with step 4 in a line or two.
Try it first. About 18 minutes for 9 marks. Write it out, then open the solution.
Solution
Hover or tap a marked figure, like 72,000, to see how it is made and where else it appears.
Returns to scale describe how output responds in the long run when all inputs are increased in the same proportion, so that the scale of the firm changes while the proportions between inputs stay the same. Raise every input by 10%, say, and output may grow by more than 10%, by exactly 10% or by less than 10%. (Returns to a factor, by contrast, vary one input with the others fixed.)
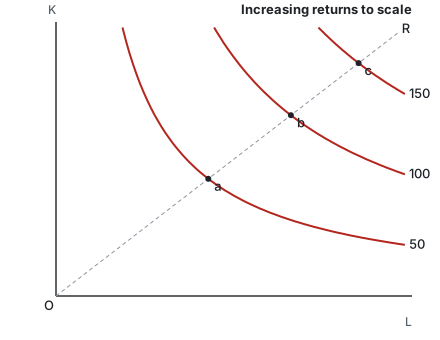
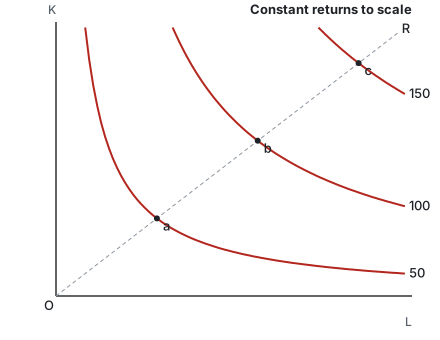
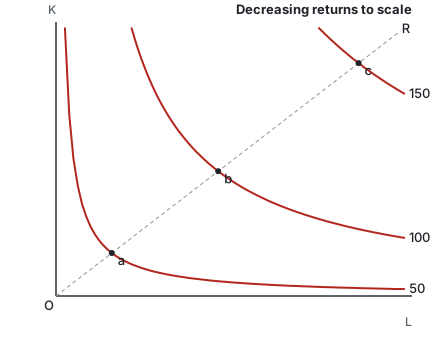
The diagrams use isoquants (curves of equal output) with labour (L) on the horizontal axis and capital (K) on the vertical axis, and a ray OR from the origin along which L and K rise in a fixed proportion. Isoquants for 50, 100 and 150 units cut the ray at points a, b and c.
The plainest case is taken first, as the yardstick, and the other two are then read as departures from it.
- Constant returns to scale (Figure 2). Output keeps exact pace with inputs: a 10% larger dose of every input gives 10% more output. Diagram: the isoquants sit at equal intervals along OR, Oa = ab = bc, since every further 50 units of output calls for the same addition to inputs. Example: opening a second identical tailoring unit beside the first.
- Increasing returns to scale (Figure 1). Output runs ahead of inputs: a 10% larger dose of every input gives more than 10% extra output. Diagram: the gaps along OR get shorter, Oa > ab > bc, since each further 50 units of output calls for a smaller addition to inputs than the last. Example: a textile unit that takes on twice the looms and workers and turns out more than twice the cloth, because at the larger size it can run a dedicated dyeing line.
- Decreasing returns to scale (Figure 3). Output lags behind inputs: a 10% larger dose of every input gives less than 10% extra output. Diagram: the gaps along OR get longer, Oa < ab < bc, since each further 50 units of output calls for a larger addition to inputs than the last.
A firm commonly passes through all three as it grows: increasing returns first, then constant, then decreasing.
Constant returns
- The economies of larger scale have been fully reaped and the diseconomies have not yet set in, or the two balance.
- Inputs are perfectly divisible, so the firm can replicate its existing operation exactly.
Increasing returns
- Indivisibilities: some inputs (a large machine, a manager, a computer system) come in lumps and are fully used only at a larger scale.
- Specialisation and division of labour: with more workers, each can concentrate on one task and become faster.
- Technical (dimensional) factors: doubling the dimensions of a tank or furnace more than doubles its capacity.
- Managerial and organisational economies: specialists can be hired for production, finance and marketing.
Decreasing returns
- Difficulties of management: coordination, supervision and communication become harder as the firm grows; decisions slow down.
- Limited entrepreneurship: the decision-making ability at the top cannot be increased in the same proportion as other inputs.
- Diseconomies outweigh economies: beyond some size, internal and external diseconomies (management, coordination, scarcer specialised inputs) exceed the economies of scale, so output grows less than in proportion to inputs.
Returns to scale are increasing, constant or decreasing according as output grows faster than, in step with, or more slowly than all inputs together. Indivisibilities and specialisation explain the first phase; balance between economies and diseconomies the second; and management limits the third. Firms use this to judge how large a plant to build.
Where the 9 marks sit
| # | Component | Marks |
|---|---|---|
| 1 | Meaning of returns to scale | 1 |
| 2 | Three types with isoquant diagrams | 4 |
| 3 | Factors responsible for each | 3 |
| 4 | Conclusion | 1 |
| Total | 9 |
Report a problemopens an email to admin@getkunji.com with the question ID7506-Q3aalready filled in.