Question 2 (a)
The budget line and its shifts
9 marks
- Time to write
- About 18 minutes
Question
Question 2 (a) · 9 marksWhat is budget line? Under what circumstances will it shift? Explain with diagram.
Reworded from the university paper; the task is the same. The original paper belongs to the University of Delhi. See DU's question bank.
Before you write
Read off the question and its marks
Read from the question
- What…?Explain…3 asks, each with its own marks below. Answer all 3.
- diagramDraw the diagram, and label both axes and every curve.
Write it in this order
- Read; underline the asks; jot your points 1 min
- 1 Meaning of the budget line, with example 2 marks 4 min
- 2 Equation, intercepts and slope 2 marks 3 min
- 3 Shifts with diagrams: income change, price change, proportional changes 5 marks 9 min
- Check: every ask answered, key terms underlined 1 min
Easy marks
- Step 1 opens with the meaning: a one-line definition, the quickest mark in it.
Short on time? Trim steps 1–3 evenly rather than skip one: each is capped at its own marks.
Try it first. About 18 minutes for 9 marks. Write it out, then open the solution.
Solution
Hover or tap a marked figure, like 72,000, to see how it is made and where else it appears.
The budget line (price line) shows all the combinations of two goods that a consumer can buy by spending the whole of a given money income at given prices. Points on the line exhaust the income; points inside it leave some income unspent; points outside it cannot be afforded. Together with the area inside it, the line marks out the consumer's attainable set.
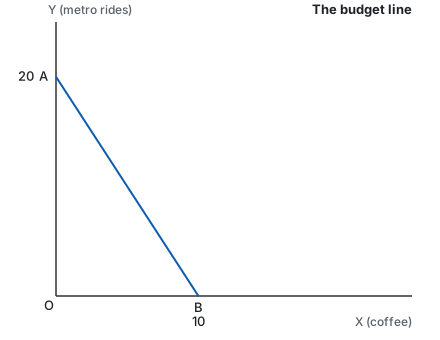
Example (our own). A student has ₹600 a month to spend on coffee (₹60 a cup) and metro rides (₹30 a trip). She can buy 10 cups and no rides, 20 rides and no coffee, or any mix such as 5 cups and 10 rides.
Equation, intercepts and slope
With income M, price of X equal to Pₓ and price of Y equal to Pᵧ, the budget line is
Pₓ·X + Pᵧ·Y = M.
- Intercept on the X-axis = M/Pₓ (all income spent on X); in the example 600/60 = 10 cups.
- Intercept on the Y-axis = M/Pᵧ (all income spent on Y); in the example 600/30 = 20 rides.
- Slope = −Pₓ/Pᵧ, the rate at which the market lets the consumer exchange Y for X. In the example −60/30 = −2: one more cup of coffee costs two metro rides.
Diagram. X on the horizontal axis, Y on the vertical axis; a straight line AB joins the Y-intercept A (M/Pᵧ) to the X-intercept B (M/Pₓ), sloping downward.
- A change in money income (prices unchanged). A rise in income shifts the line outward parallel to itself, since both intercepts rise in proportion and the slope −Pₓ/Pᵧ is unchanged; a fall in income shifts it inward. Diagram: AB moves to the parallel line A′B′ further from the origin.
- A change in the price of one good. If Pₓ falls, the X-intercept M/Pₓ moves outward while the Y-intercept stays put: the line rotates (pivots) outward about A and becomes flatter. A rise in Pₓ rotates it inward about A. A change in Pᵧ pivots the line about the X-intercept B instead. Diagram: AB swings to AB′ (Pₓ falls) or AB″ (Pₓ rises).
- Equal proportional change in both prices. If both prices rise by 10%, the relative price is unchanged, so the line shifts inward parallel to itself, exactly as if income had fallen; if both prices fall by the same proportion, it shifts outward parallel to itself, as if income had risen.
- Income and prices change in the same proportion. If income and both prices double, the intercepts and slope are unchanged and the budget line does not move.
- Other changes. A per-unit subsidy or tax on one good changes its effective price and so rotates the line. A ration (a cap on the quantity of one good) does not change its price; it cuts off the part of the line beyond the cap, leaving a kinked budget set.
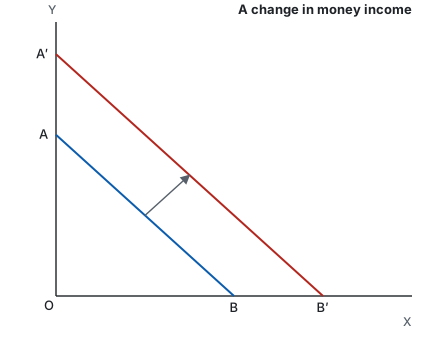
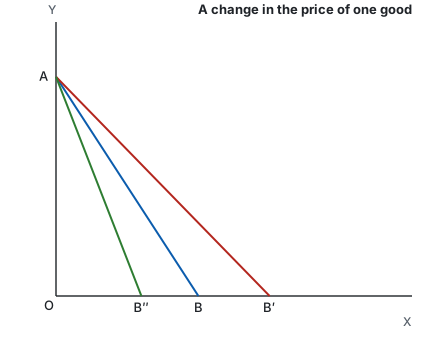
The budget line is fixed by income and the two prices. Income changes shift it parallel to itself; a change in one price rotates it about the intercept of the other good; proportional changes in both prices act like an income change. These shifts are what drive the income and price effects of consumer theory.
Where the 9 marks sit
| # | Component | Marks |
|---|---|---|
| 1 | Meaning of the budget line, with example | 2 |
| 2 | Equation, intercepts and slope | 2 |
| 3 | Shifts with diagrams: income change, price change, proportional changes | 5 |
| Total | 9 |
Report a problemopens an email to admin@getkunji.com with the question ID7506-Q2aalready filled in.